
Flaws in valuation metrics (PE & FCF%)
The Case for Owners’ Earnings

When investors value a stock, they usually look at the earnings power of the business, and the assets on the balance sheet. Today we focus on the earnings power.
We argue that the most used valuation metrics are deeply flawed. Investors measuring earnings power, typically look at one of three metrics:
1. P/E ratio
2. EV/EBIT ratio
3. Free Cash Flow yield
Each of these metrics in their own way provide a shorthand for a fully-fledged DCF valuation. DCF is the only perfect valuation approach from a formulaic point of view but requires many assumptions and predictions. Investors prefer valuation metrics, because they don’t require (explicit) assumptions. The problem with these metrics is that investors don’t always understand the large flaws inherent within them.
Flaws in the standard metrics
PE ratio
The PE ratio divides the price of a stock by its earnings per share. The problem with this ratio, is that management can reduce the P/E ratio whenever they want, by changing the capitalization structure of the business.
Without any share price change, or change to the business, management can take on debt and buy back shares of the company. As long as the interest rate % on the debt is lower than the earnings yield of the stock, which is almost always the case, the PE ratio will go down by doing this. The business didn’t change, and the share price didn’t change, so it’s questionable that the reduction in PE ratio in this way makes the company better value.
Another flaw of the P/E ratio can be found in the cash flow statement. Before the company gets the actual cash suggested in earnings, working capital changes are considered, depreciation is added back, and maintenance capex is subtracted...
The PE ratio implicitly assumes working capital does not change, and maintenance capex is approximately equal to depreciation. Depending on the type of business and their assets, this may be very close, or very far from the truth.
Chemical producers, for example, have significantly higher depreciation than they have maintenance capex. In 2024, XOM had $34b in earnings, $20b in depreciation, and an estimated $5b in maintenance capex, according to analysts. Before considering working capital and so on, Exxon thus had $49b in net cash generation. This is significantly higher than the $34b in earnings used in the P/E ratio.
PE under-rates companies that squeeze out their assets
The discussion on the difference between depreciation and maintenance capex inevitably leads to a discussion on the durability of the assets the company has. Both operationally and strategically, assets can lose their value, either as they wear down, or as they lose their relevance to the business. The rate at which this occurs is generally not well captured by the depreciation rate, and hence investors should be critical about this.
An interesting example of this was Data Communications Management, which in 2022 had 14m net earnings, 11m depreciation and amortization, and 1m in capex. The company was “depreciating” old paper factories. These factories were never going to have to be replaced, as the assets in them had been upgraded to work many times faster, enabling the company to consolidate its footprint in the future. Investors valued the company at 60m CAD market cap, with 60m CAD in net debt.
As the assets were never going to be replaced, the PE measure of 60/14 = 4.2x was much less informative, than the adjusted metric of 60/(14+11-1)= 2.4x which just looks at the cash coming in, without working capital changes and other cash flow noise.
Whatever we think about the durability of the assets, this was a growing company trading at only 2.4x cash earnings, but hiding behind depreciation of historic assets, showing how flawed a PE metric can be.
EV/EBIT does not solve all issues in PE
EV/EBIT valuation is an improvement vs PE ratio, as it is neutral to changes in the companies’ capitalization structure. This ratio does not help with the issue of understated earnings power though. It also sits below the depreciation line in the income statement.
For the case of DCM, its 2024 EV/EBIT multiple would have been 120/25 = 4.8x vs adjusted 120/(25+11-1) = 3.4x. It still provides a seriously skewed picture.
Free cash flow yield is even worse
Given these flaws, investors sometimes turn to Free Cash Flow, which we think is the worst of all measures.
The issues we have with free cash flow are:
1. Growth capex is taken out of free cash flow, as if it doesn’t exist and has no value.
2. Share based compensation is excluded from free cash flow – this is such an obvious gap that we don’t need to go further into it.
3. Working capital changes are excluded from free cash flow, again penalizing growth companies, but in an even less well-understood way
On the third point above, when a company grows its business, and does more of what it does, we should expect its inventory to rise, its receivables to rise, and its payables to rise. Most companies have positive working capital, so we should hence expect this to increase as the company grows, consuming some cash. This is actually a good thing!
Let’s look at Spyrosoft’s 2021 cash flow statement:

Most investors would calculate free cash flow here as Cash Flow from Operations, minus investments, which is 14.5 – 5.2 = 9.3m PLN.
Spyrosoft had a market cap of ~250m PLN when the 2021 report was published, or a FCF yield of ~3.7%. This does not look cheap at all.
The main detractor to FCF through, as we see above, was growth in receivables of 18m. Spyrosoft from 2020 to 2021 grew receivables and revenue as shown below. We see that days receivables went up only slightly.
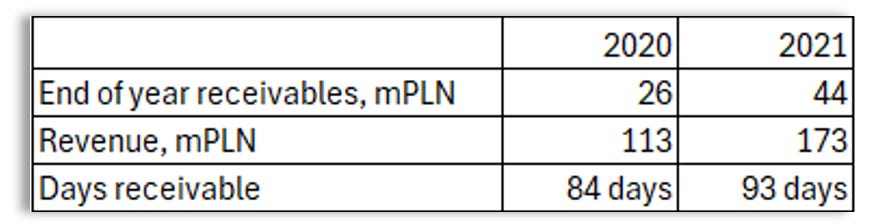
One could simulate the receivables Spyrosoft would have at end of 2021, if days receivables outstanding had not changed. Such simulation would show that of the 18m cash flow into receivables, only 4m was the result of increasing days outstanding. The remaining 14m was the result of the growth of the business.
Spyrosoft had more contracts, more work completed, and more invoices waiting to be paid by customers. There is no way to grow a consultancy business while avoiding this increase.
Investors should keep a close eye on days receivables and should view cash going into receivables or inventory in the same way as cash going into capex, making a clear distinction between use of cash for Growth, versus for Ongoing business. (like growth capex vs maintenance capex)
The real earnings power for Spyrosoft here, was shown not in their free cash flow, but in their earnings, which were 18m for 2021, or a PE multiple of 250/18 = 14. This was very low for a founder-led business with consistent > 50% organic growth. The company had little depreciation and little debt, making the PE ratio an appropriate measure.
Free cash flow was very misleading in this case. We see investors often misusing it for high growth companies. When used, it should be adjusted for growth capex and growth working capital, to avoid downplaying the earnings power of the best businesses.
Warren Buffet’s solution: Owners’ earnings
Warren Buffett, faced with the problems explained above, came up with owners’ earnings, of which he wrote in his 1986 annual letter:
“Owner earnings represent (a) reported earnings plus (b) depreciation, depletion, amortization, and certain other non-cash charges such as one-off inventory write offs, and deferred tax charges, less (c) the average annual amount of capitalized expenditures for plant and equipment, etc. that the business requires to fully maintain its long-term competitive position and its unit volume.”
“Our owner-earnings equation does not yield the deceptively precise figures provided by GAAP, since(c) must be a guess - and one sometimes very difficult to make. Despite this problem, we consider the owner earnings figure, not the GAAP figure, to be the relevant item for valuation purposes”
Based on Mr. Buffett’s explanation above, we could come up with the formula:
· Owners’ Earnings (OE)1 = Recurring net income + D&A – mtc. capex
The ration to use is then:
· Owners’ multiple = Market cap / Owners’ earnings
Using this metric enables us to see the true cash generation power of a company like Data Communications Management, as well as the true earnings power of Spyrosoft, avoiding the pitfalls of IFRS/ GAAP based valuation metrics.
We feel strongly that investors underestimate the use of owners’ earnings. Using correct valuation measures is critical to evaluating value stocks and realizing great returns.
Disclosure
We don’t have positions in any of the securities discussed above.
Disclaimer
This publication’s authors are not licensed investment professionals. Nothing produced by the Floebertus team should be construed as investment advice. Do your own research.
Appendix - Our own favorite multiple
As a matter of personal taste, we like to divide owners’ earnings by ex-cash market cap. In our opinion, debt is often well reflected in earnings, with companies paying 7-10% interest, while cash often isn’t, with companies’ earning 2-3% on their cash. This is why we like to use a cash-adjusted owners multiple:
· Owners’ multiple = (Mkt cap – cash) /(OE – interest income)
This is easier to calculate than owners adjusted EV/EBIT and it does the job for the growing companies with limited debt we are looking for.
We require both ratios to be low:
- Cash-adjusted owners’ multiple being low, as indication of true value
- Non-cash-adjusted owners’ earnings being low, to act as a catalyst for the company to clearly be worth more next year vs this year.
The non-cash-adjusted ratio helps exclude net-nets without clear earnings power, as their situation does not clearly change over time, limiting the probability and the size of a potential re-rating.
We take a similar approach to evaluating capital efficiency, calculating ROA as:
· Owners’ ROA = OE / (Assets – cash)
This ratio again is less informative than “Owners’ ROIC”, but good enough and possible to calculate while glossing over financial statements. We like to mentally calculate Owners’ ROA first, then going into Owners’ ROIC while getting hooked on a business.
Footnotes
1: Mr. Buffett has mentioned that he would also subtract working capital multiplied by inflation from owners’ earnings, if inflation is significant. We have left that out here for simplicity.
Hi Flo. I have a question on the below:
"We require both ratios to be low:
- Cash-adjusted owners’ multiple being low, as indication of true value
- Non-cash-adjusted owners’ earnings being low, to act as a catalyst for the company to clearly be worth more next year vs this year.
The non-cash-adjusted ratio helps exclude net-nets without clear earnings power, as their situation does not clearly change over time, limiting the probability and the size of a potential re-rating."
Can you explain in more detail how the non-adjusted OE multiple can exclude undesirable net-nets? I don't quite follow the logic here. Thank you.