

Death Valley super-blooms

Death Valley is well known by many for its harsh, dry, hot and salty conditions. Noami Fraga, assistant professor at Claremont University, however, knows the famous desert for its ability to produce infrequent, large, colorful super-blooms …
While the desert provides a torrid environment for the California flora, occasionally, flowers bloom without restraints. Fraga feels a sense of dread when a winter rain, strong enough to set up a super-bloom occurs. She admires the colorful display of nature, but calls for moderation, as herds tourists flock to the mountains, predictably turning the beautiful landscape into a victim of the selfie industry.[3]
2025 Financial markets are nothing like the California desert. Markets never seem dry and lifeless these days. Much like the American landscapes though, when flowers bloom, they can grow broader, more beautiful, more colorful, and higher than investors could ever imagine.
When stocks super-bloom
In 1993, Jegadeesh and Titman[1] described the tendency of stocks to trend, first covering stock momentum. This been “missed” in the original 1992 Fama French paper[2] focusing on Value, Size, and Market risk.
Jegadeesh and Titman write:
“… strategies which buy stocks that have performed well in the past … generate significant positive returns over 3- to 12-month holding periods. We find that the profitability of these strategies are not due to their systematic risk or to delayed stock price reactions to common factors. However, part of the abnormal returns generated in the first year after portfolio formation dissipates in the following two years. A similar pattern of returns around the earnings announcements of past winners and losers is also documented.”
Single stock rallies, when they occur, tend to reinforce themselves. They keep running, they super-bloom, attracting the memetic tourist masses… The researchers discussed 4 main reasons for this:
1. Delayed price reactions to firm specific information
Stock prices do not immediately reflect Firm specific news (like positive earnings). This underreaction, or cascaded reaction, drives a persistence bias, where stocks that do well on earnings often continue to do well in the ensuing months. This is because investors need time to digest information, release their price bias and adjust their views to the information.
2. Exuberance: Overreaction to information, leading to temporary price movements
During the months after positive news, the initial underreaction in single stock prices tends to shift to an overreaction to the news. This may seem like a contradiction at first. The research however shows that stocks rally so much that a period of underperformance typically follows the initially observed mid-term outperformance.
3. Momentum trading strategies pushing prices further into their trading direction
Besides reaction to information, momentum trading strategies aiming to exploit the 2 biases described above exacerbate the tendency for single stocks to trend.
4. Trends because of persistent flows
As some single stock price moves are the result of flows, these moves tend to persist over the mid-term, as their flows persist. This is valid for several types of flows, whether resulting from passive investing, index inclusion or exclusion of single stocks, or tax loss selling.
Understanding this research, we should know as investors, to focus our criticism on the underperformers in our portfolio, and to give some leeway for winners to super-bloom… This is one of the hardest things in investing. Our human biases described in (1) and (2), are almost impossible to avoid. When we have a winner, we don’t want to increase our bet, we don’t want to gamble it… Our gut want to take profits and run. When we have a loser, our gut says average down, reduce cost basis, even though we don’t remember a time when that actually worked.
Key take-away:
1. Stocks tend to keep trending over the medium term. We will miss large gains if we don’t appreciate this medium-term (~12 month) tendency.
2. Stocks that jump on great earnings present a potential buying opportunity. The market needs time to integrate information. Understanding or accepting information faster than the market, can enable improved performance (buying winners / cutting losers)
3. Price bias should be avoided. Simply ignoring the chart, and looking at the fundamentals, often serves us greatly.
It almost always works better holding winners, than throwing good money after bad.
Sources & References
[1]: THE JOURNAL OF FINANCE * VOL. XLVIII, NO. 1 * MARCH 1993: Returns to Buying Winners and Selling Losers: Implications for Stock Market Efficiency, N. JEGADEESH and S. TITMAN
https://www.bauer.uh.edu/rsusmel/phd/jegadeesh-titman93.pdf
[2]: THE JOURNAL OF FINANCE June 1992: The Cross-Section of Expected Stock Returns, EUGENE F. FAMA, KENNETH R. FRENCH
https://onlinelibrary.wiley.com/doi/full/10.1111/j.1540-6261.1992.tb04398.x
[3]: LA Times, February 2023: Your ‘super bloom’ selfie isn’t worth destroying California’s ecosystems, Naomi Fraga
Disclaimer
This publication’s authors are not licensed investment professionals. Nothing produced by the Floebertus team should be construed as investment advice. Do your own research.
Appendix
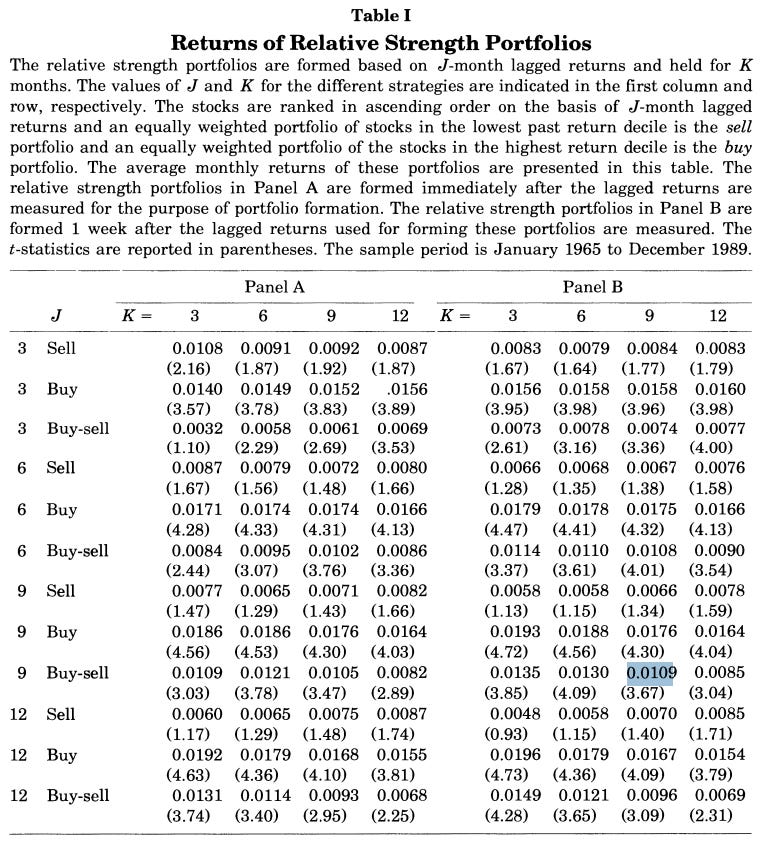
The Jegadeesh-Titman paper provides a quantitative reference as well. They show that a portfolio of top decile rising stocks (selected over the past J months), performs significantly better (over next K months) than a portfolio of declining stocks. They call the rising stocks the “buy portfolio” and the declining stocks the “sell portfolio”. They observe excess returns for the buy portfolio, both when the observation time interval (of J months) and the measurement interval (of K months) are adjacent (panel A) or are separated by 1 week (panel B).
It is hard to hold, especially if it is a huge position.